Department of Agriculture map of global tobacco production.
World of Tobacco.
Out of stock
Description
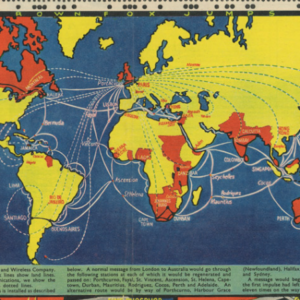
This thematic map, titled World of Tobacco, was published by the United States Department of Agriculture in 1971. The aim was to provide viewers with geographical and historical insight into tobacco production and use contexts. The map depicts most of the world, excluding only regions where tobacco is non-existent or irrelevant. The full scope of the main map is shown on a smaller inset in the lower left corner.
The mapmaker divides global tobacco yields into four classes with color coding: orange for flue-cured tobacco, blue for light-cured tobacco, green for oriental and semi-oriental tobacco, and black for all other types. This classification shows that different parts of the world pursue this industry in different ways. In the United States, most production falls within the two types of cured tobacco, while the situation in Mexico is far more sporadic and of mixed pedigree. In Africa and Asia, predominantly orange and black dominate, indicating flue-cured and “other types” of tobacco crops. Europe and the Middle East also show some diversity, although the concentrated production areas around the Black Sea rely mainly on the oriental tobacco types.
An American crop
Native to the Americas, tobacco had been employed by indigenous communities for medicinal and religious purposes long before the age of discovery. With the spread of colonialism, tobacco found its way to Europe, where it soon gained immense popularity. Its widespread adoption made it a significant cash crop cultivated worldwide. This historical perspective highlights an evolution of attitudes toward tobacco use, from its initial acceptance and popularity to the growing awareness of its health risks in recent years.
Despite a fundamentally different attitude to smoking at the time, our map does show that things had begun to change in America by the 1970s. Below the map, several pie charts indicate both production and consumption levels worldwide. A separate pie chart in the Indian Ocean shows the US share in global production and consumption in 1955 and 1969, respectively. This chart makes it clear that even in the 1950s and 1960s, tobacco production and consumption were already declining in America.
An inappropriate subject?
Even though the very notion of this map may be considered a nonstarter in the 21st century, at the time it was produced, tobacco was still one of the most commonly used stimulants in the United States. In the mid-1960s, the first medical studies that linked tobacco use to various diseases emerged. Still, it was only with the enactment of the Family Smoking Prevention and Tobacco Control Act (Tobacco Control Act) in 2009 that the U.S. Food and Drug Administration was given the legal authority to regulate the manufacture, marketing, and distribution of tobacco products in America. In other words, it is essential to recognize that smoking was still a widely accepted social activity that was not perceived as an immediate health hazard when this map was produced.
Census
The map was produced in 1971 by the US Department of Agriculture’s dedicated ‘Tobacco Division.’ We have found no other listings of this map on the market and see only a few institutional examples in the collections of the University of Leiden in the Netherlands (OCLC no. 236433020) and the Royal Library in Copenhagen, Denmark (OCLC no. 475768781).
Cartographer(s):
Condition Description
Very good. Wear along fold lines and at intersections.
References
![[World] Continentem Dudum Notam Componebat & Continentem Noviter Detectam Componebat.](https://neatlinemaps.com/wp-content/uploads/2024/04/NL-01969-composite_thumbnail-300x300.jpg)