A cornerstone map for the historical cartography of San Francisco.
City of San Francisco and its Vicinity.
Out of stock
Description
This famous 1859 Coast Survey chart of San Francisco depicts San Francisco about a decade after the Gold Rush and the dramatic demographic and economic changes it brought. What was once a few scattered Mexican settlements surrounded by sand dunes has now become a major port city, the most important West Coast maritime hub in a country that existed for less than a century.
This transition is evident if we compare the 1859 chart with an earlier one from 1853. Today’s commercial district, once the tiny village of Yerba Buena, has increased drastically. Although large parts of San Francisco burned down at least five times in the 1850s, the intricate detail on the map reveals the scope of development both inland up the hills and out into the water. By auctioning off water lots to be infilled and incorporating scuttled ships into the waterfront, the shoreline of Yerba Buena Cove was quickly pushed outward. It is easy to imagine the bustling and wild city built by an influx of fortune-seekers from all over the world.
Elsewhere, however, the vibe is decidedly more bucolic. To the west, across Larkin St. and the 1852 city charter line, buildings are more scattered. This area was essentially San Francisco’s “countryside,” from where we get neighborhood names like Cow Hollow, an area dotted with dairy farms. In the vicinity of the intersection of today’s Laguna and Greenwich Streets, we see a large body of water labeled Washerwoman’s Lagoon. Here, an enterprising community of Chinese immigrants, disillusioned at harsh treatment in Gold Country mines, established laundry businesses.
The original Mission neighborhood contrasts sharply with the bustling boom town port to its north. The reason for this contrast is that the Mission remained largely disconnected from the rest of San Francisco at this time, separated by enormous sand dunes that have since been blasted away. Despite constructing a plank toll road, the best way to get from the San Francisco waterfront to the Mission was to sail a small boat around Mission Rock and up Mission Creek.
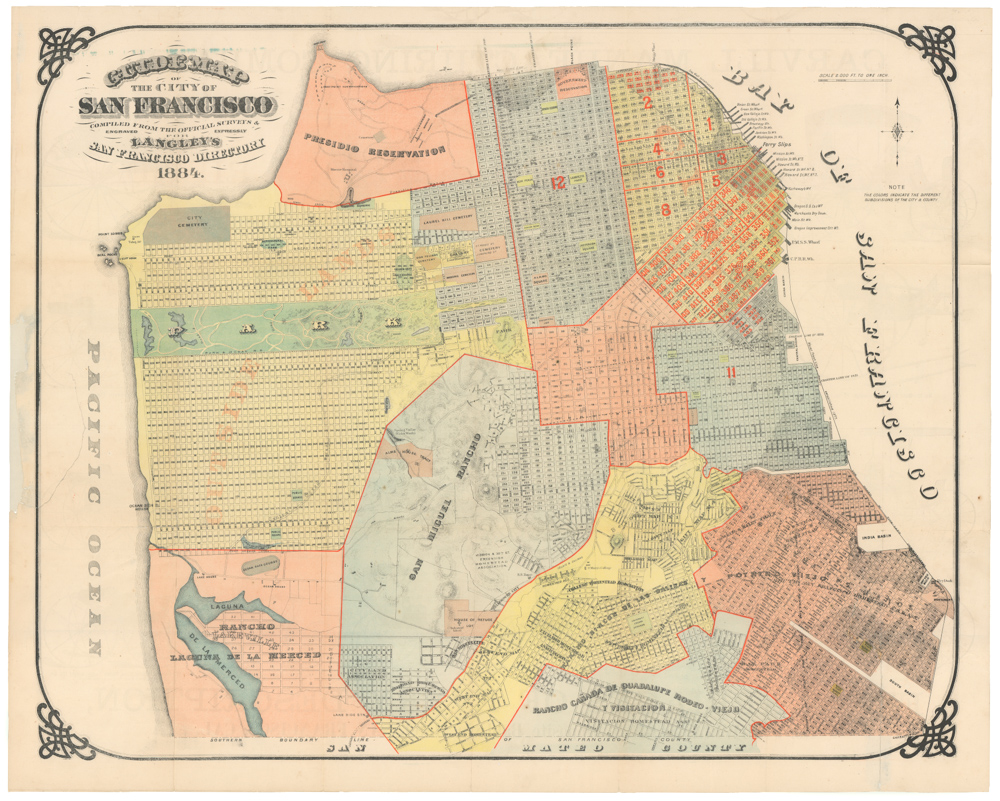
And finally, the chart’s depiction of the area south of Market St. is exciting for viewers interested in the history of San Francisco. It shows the area in the process of industrialization. If we look at later 19th-century maps of the city, for example this 1884 Langley directory map, we note how, in subsequent decades, the southeast coastline of San Francisco became home to numerous factories, industrial facilities, and maritime enterprises. As part of this process, the shoreline was pushed out and consolidated. In 1859, we are only at the inception of this transformation. Potrero Nuevo is largely empty, with only the Rope Works and a few scattered structures visible in today’s Dogpatch neighborhood.
Mission Bay is still open and large. Less than a decade later, the construction of Long Bridge (roughly today’s 3rd St.) would enclose the bay and eventually doom it to infilling.
Cartographer(s):
The Office of Coast Survey is the official chartmaker of the United States. Set up in 1807, it is one of the U.S. government’s oldest scientific organizations. In 1878 it was given the name of Coast and Geodetic Survey (C&GS). In 1970 it became part of the National Oceanic and Atmospheric Administration (NOAA).
The agency was established in 1807 when President Thomas Jefferson signed the document entitled “An act to provide for surveying the coasts of the United States.” While the bill’s objective was specific—to produce nautical charts—it reflected larger issues of concern to the new nation: national boundaries, commerce, and defense.
Alexander Dallas Bache, great-grandson of Benjamin Franklin, was the second Coast Survey superintendent. Bache was a physicist, scientist, and surveyor who established the first magnetic observatory and served as the first president of the National Academy of Sciences. Under Bache, Coast Survey quickly applied its resources to the Union cause during the Civil War. In addition to setting up additional lithographic presses to produce the thousands of charts required by the Navy and other vessels, Bache made a critical decision to send Coast Survey parties to work with blockading squadrons and armies in the field, producing hundreds of maps and charts.
In 1871, Congress officially expanded the Coast Survey’s responsibilities to include geodetic surveys in the interior of the country, and one of its first major projects in the interior was to survey the 39th Parallel across the entire country. Between 1874 and 1877, the Coast Survey employed the naturalist and author John Muir as a guide and artist during the survey of the 39th Parallel in the Great Basin of Nevada and Utah. To reflect its acquisition of the mission of surveying the U.S. interior and the growing role of geodesy in its operations, the U.S. Coast Survey was renamed the United States Coast and Geodetic Survey (USC&GS) in 1878.
Condition Description
Very good. Some minor tears in margins.
References
Related products
-
-
Add to cart
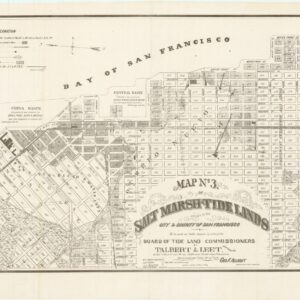
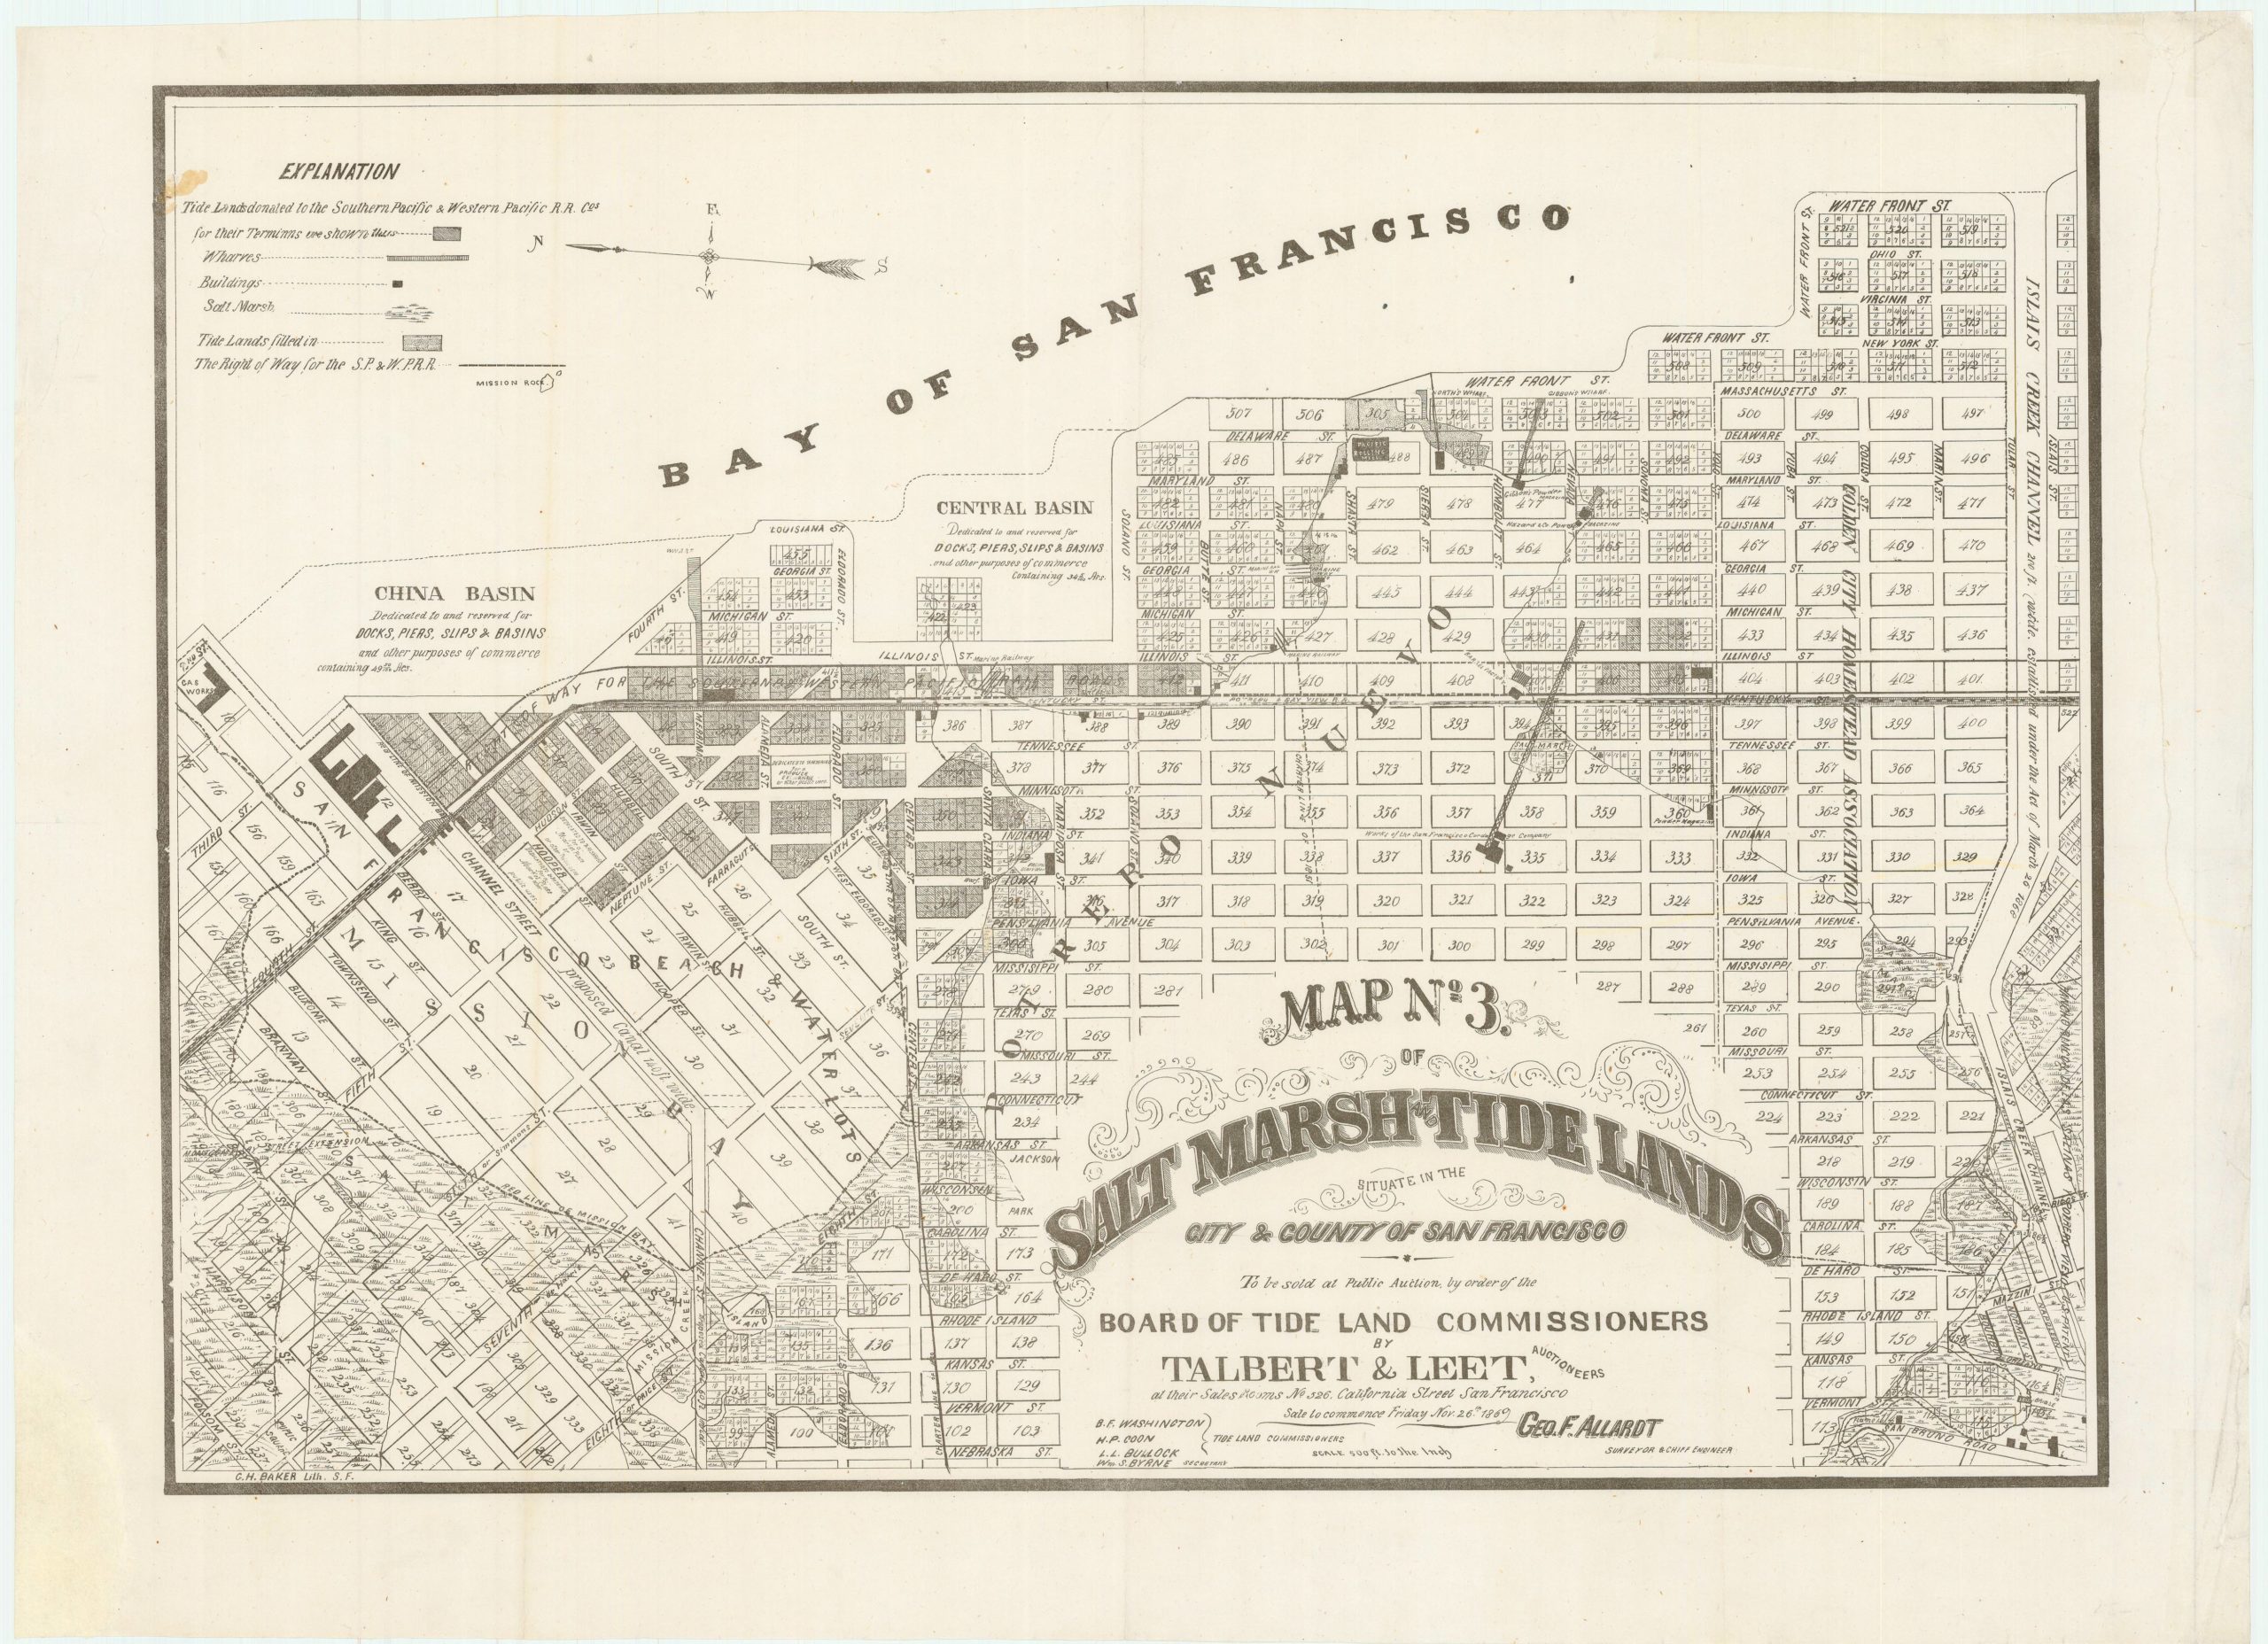
- San Francisco
Map no. 3. Salt marsh and tide lands situate in the city and county of San Francisco. To be sold at public auction by order of the Board of Tide Land Commissioners by Talbert & Leet, auctioneers, at their sales rooms no. 526 California Street, San Francisco. Sale to commence Friday Nov. 26th, 1869.
- $3,400
-
-
-