A unique and unrecorded variant of William M. Eddy’s iconic 1851 Red Line Map of San Francisco. With evidence of ownership by the great San Franciscan jurist Samuel Wirth Holladay, the first known civil rights lawyer to fight for African-American rights in California.
Map of the City of San Francisco, full and complete to the present date. Compiled by Wm. M. Eddy, City Surveyor. January 15th, 1851
Out of stock
Description
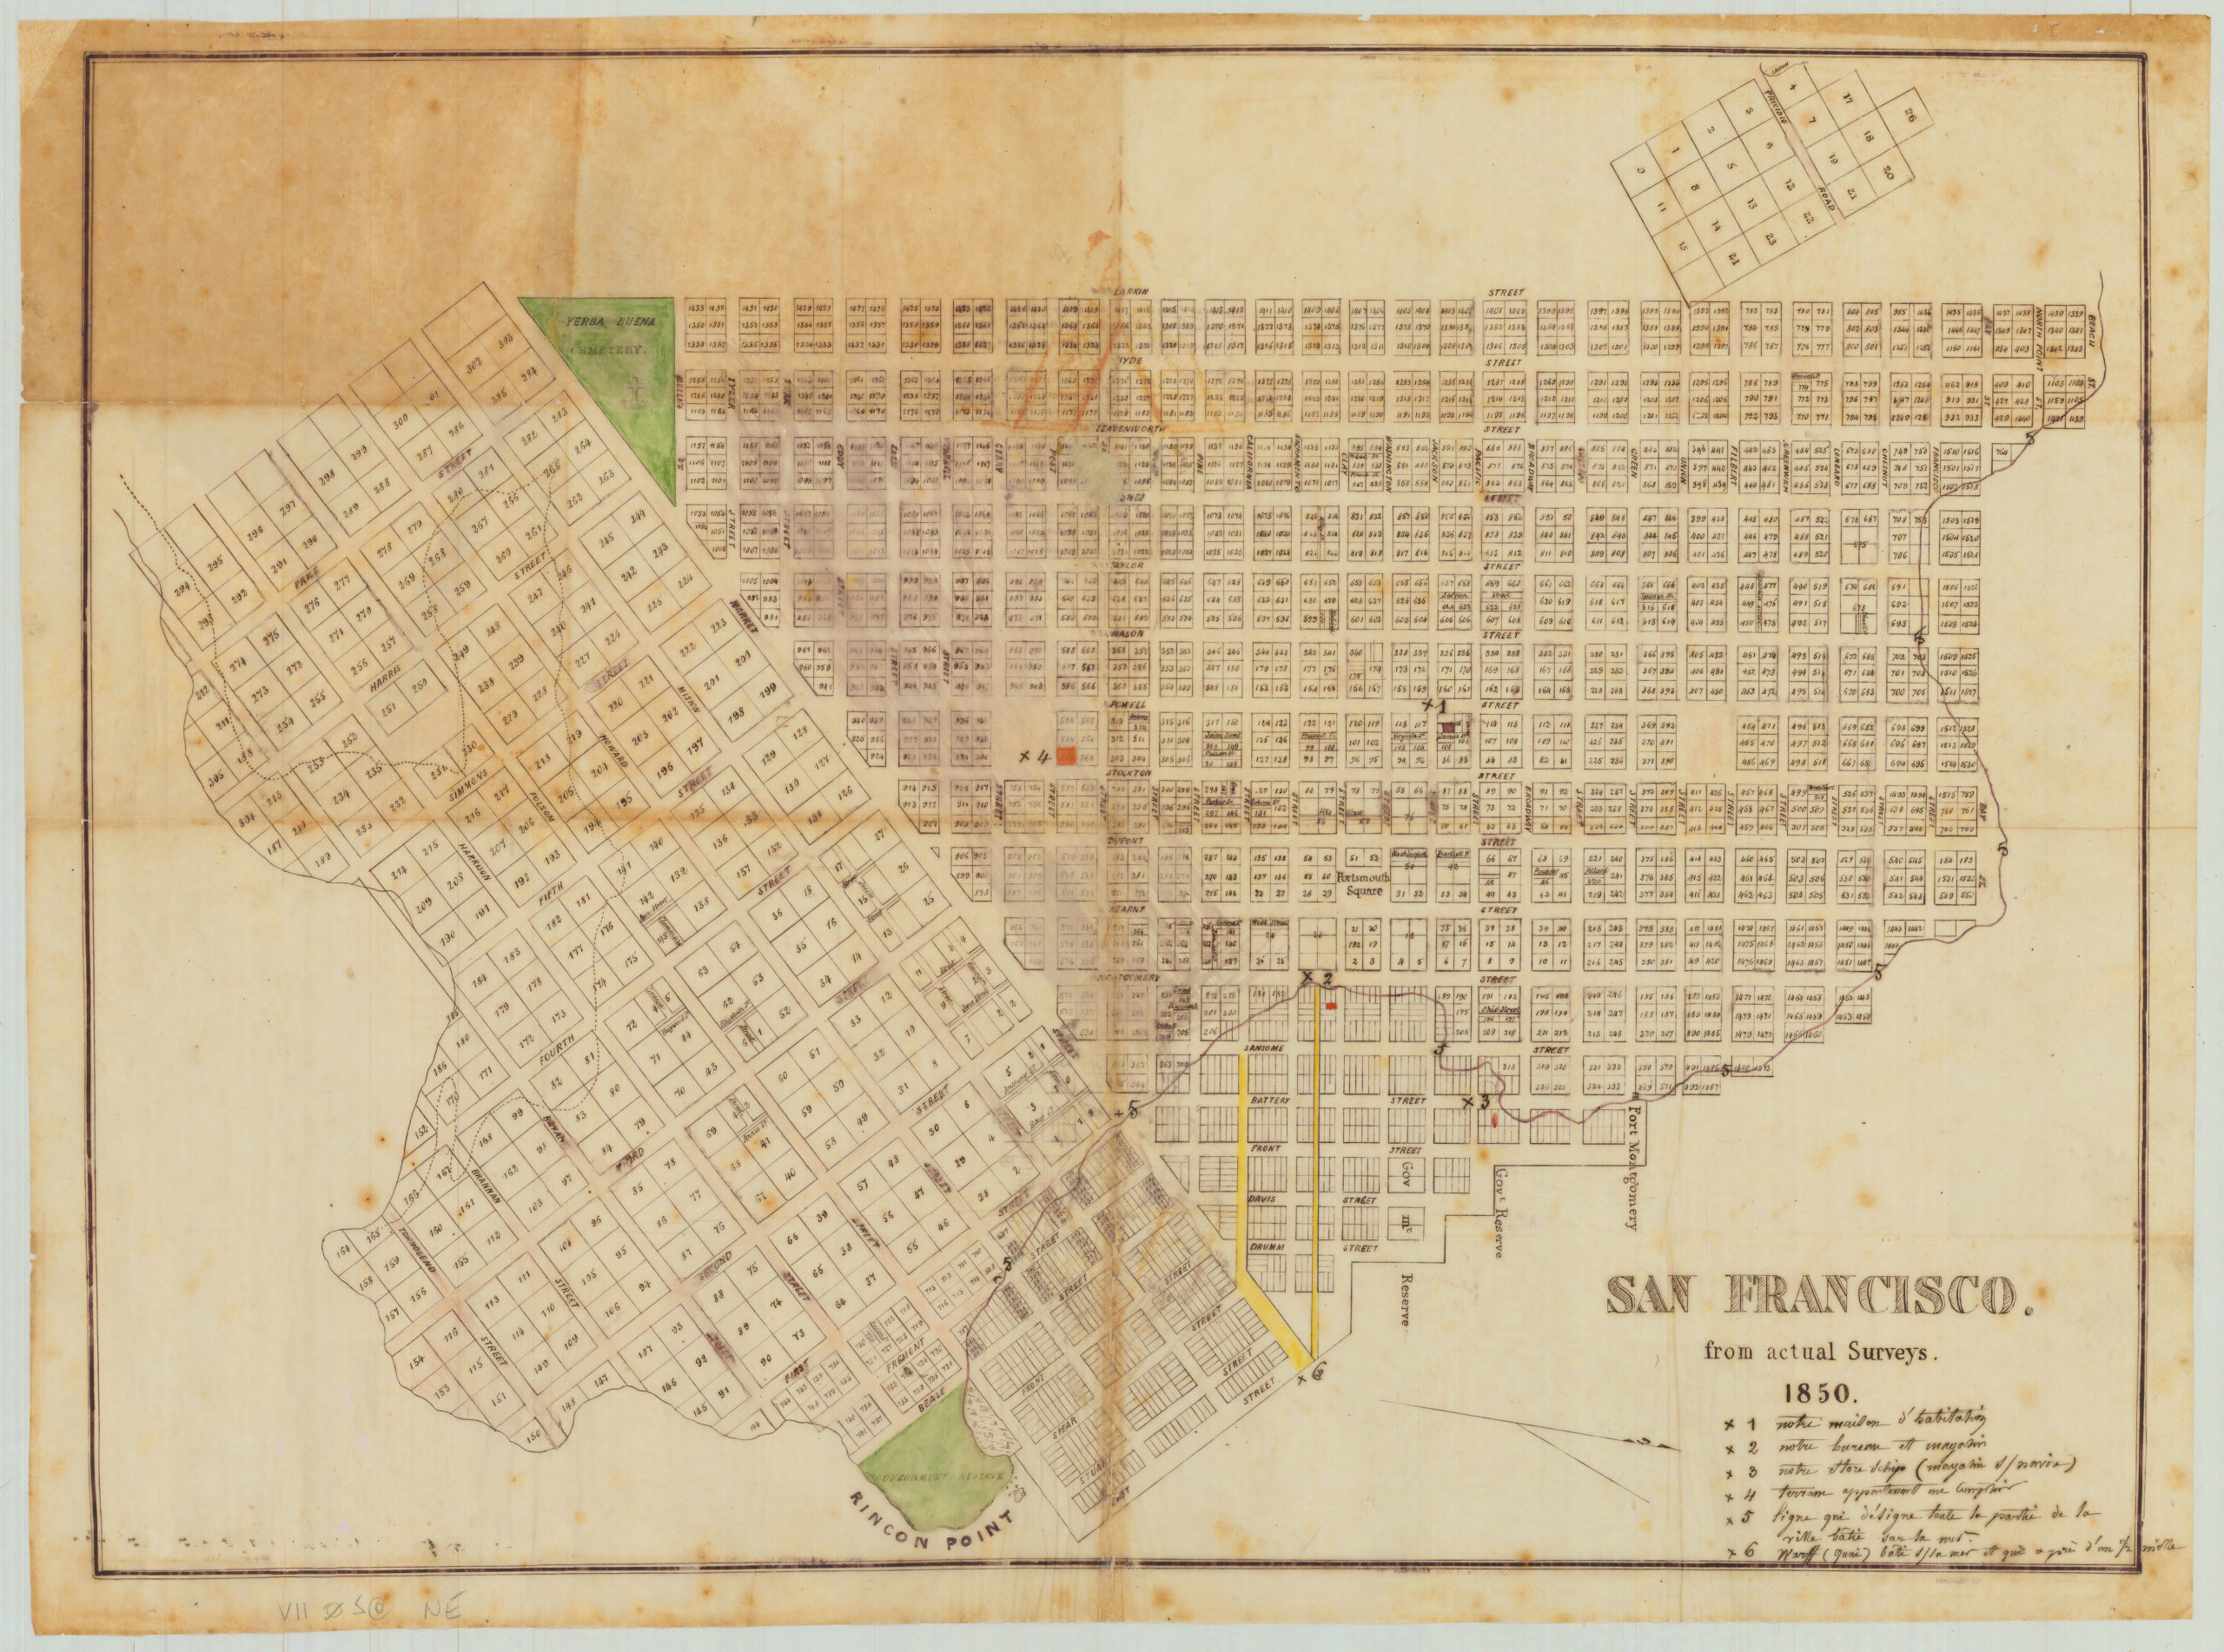
The historical mapping of San Francisco constitutes a rich testimony to the rapid (sometimes outlandishly so) progress that the city experienced during the mid-19th century. Of the countless maps and charts produced during these formative years, few have become as seminal and iconic as those compiled by City Surveyor William M. Eddy. With the superlatives out of the way, let us get straight to the point: This is a map for people who are interested in the urban genesis and micro-history of San Francisco during its formative years (1847-51). This was a time in which the city was transformed at a relentless pace; in which a period of just a few months could see parts of the city double its population, burn down, rebuild, or even alter its name, charter, and boundaries; all while continuously expanding its footprint out into the bay. At the center of it all, documenting the complex and messy process, were of course surveys and maps. And at the root of most of these maps was one persistent theme: real estate organization and speculation, especially the granting of town lots and the sale of water lots to private ownership.
The era in question can be a challenge for historians of San Francisco to decipher comprehensively, in part because there are constantly new perspectives to consider or new historical documents brought to light, as is the case for the map being offered here. It is crucial to understand the general cartographic chronology for this period in order to appreciate how rare and important our map actually is. A quick overview of some of themes found in important city maps of the period may thus help contextualize our map and elucidate its historical significance:
The BUCKELEW MAP (also known as the Bartlett Map): Commissioned by a group of real estate commissioners, certified on February 22, 1847. Manuscript map; no known originals have survived.
The O’FARRELL SURVEY MAP: O’Farrell was commissioned by Chief Magistrate Bartlett to produced a new, accurate plan of the city by realigning streets and blocks, and surveying the shoreline. He worked from March to August, 1847, and produced a maunscript map that we might call the first “modern” map of San Francisco. The map is assumed to have been destroyed in the fire of 1906 and only reduced version copies survive, for example in Thomas Burns’s Centennial of the City of San Francisco (1935).
The ORIGINAL EDDY RE-SURVEY MAP: Eddy’s mission was to resurvey the original 1847 plan laid out by Jasper O’Farrell (which was filed but never published), and to do so in a way that met both the demands of the expanding population as well as the need to replenish city coffers. Eddy carried out his work in the summer and fall of 1849 and filed the resulting official map on February 1, 1850, in Oregon City, Oregon, the site of the nearest Federal District Court. Interestingly, this original manuscript map (with no copies), still held in Oregon, did not include Yerba Buena Cemetery, which was staked out the next month, in March of 1850; the need for a city cemetery did not occur to city officials until the map was already on its way to Oregon (hat tip to historian Angus McFarland for this information).
The EDDY REPORT MAPS: Eddy’s map, with Yerba Buena Cemetery added in, was published in various city reports throughout 1850 and 1851. It always carries the publishing location of Washington, D.C. in the title but was certainly printed in San Francisco as well, as attested by a notice in the March 11, 1850 Daily Alta California newspaper advertising lithographic copies of the official map.
The year 1850 also saw a number of San Francisco City maps published in New York. From the outset of the Gold Rush, New York had maintained close commercial ties to San Francisco, as New York businessmen made their way out west and took advantage of the newly-created West Coast market. Maps were a natural bi-product of these ties, and 1850 saw the publication of the MILLER MAP (only one known copy, at UC Berkeley), and the recently discovered Sun Lithographic Establishment APOLLO MAP (again, only one known copy, at Stanford University).
We see, therefore, that by 1850 there was only one widely-distributed map of San Francisco: the Eddy report maps. It is necessary to make a distinction here (as observed by Angus McFarland in a forthcoming article in The Argonaut magazine): technically-speaking, Eddy’s report map does not depict the boundaries of the city of San Francisco because San Francisco was not incorporated as a city until its charter was passed on April 12, 1850. From the time Yerba Buena Pueblo was claimed by U.S. Naval Officer Captain John Montgomery in July of 1846, until the 1850 Charter, San Francisco was in fact a territory comprised of Federal land. During this same period, the city was renamed as San Francisco (January 1847) and its population grew from a handful of families to over twenty thousand.
A new map for 1851: Eddy RED LINE A
The official incorporation of the city in April of 1850 most certainly explains the need for Eddy to update his report map, which was published by B. F. Butler’s Lithography Company in San Francisco on January 15, 1851, eight months after the charter was passed. Because the original shoreline and the projected line that would eventually become the Davis/Embarcadero Seawall have been traced in red ink, this map is widely-known among scholars of San Francisco maps and urban history as Eddy’s Red Line Map. We believe that the map being offered here establishes that the Red Line Map is actually part of a three map sequence that needs to be distinguished as such. Consequently, we will henceforth refer to this map as Eddy RED LINE A. The formal title noted on the map is: “Official map of the City of San Francisco, Full and complete to the present date. Compiled by Wm., M. Eddy. City Surveyor. January 15th. 1851.”

A first glance, the RED LINE A (1851) may seem similar to the Eddy report map (1850), but a closer examination makes a number of important distinctions stand out, and an understanding of the city’s micro-history reveals just how much could change in a single year during this formative era. The 1850 Charter established a western boundary at approximately present-day Webster Street, and a southern boundary at about present-day 17th Street. Eddy delineates these city limits on his new map. In order to display the additional area, Eddy has adjusted the scale slightly. He has also shifted the title of the map from the upper right corner to the left side, presumably to fill the new blank space there. A more elegant and prominent compass rose has taken its place at upper right. Additionally, streets and alleyways that were unnamed in the previous map have now been labeled, and there is a new 100 vara public square that has been designated between Folsom, Harrison, Harris, and Simmons Streets (today’s Victoria Manalo Draves Park).
More importantly, however, RED LINE A depicts a significant new area south of Market Street curving toward Mission Dolores. The report map’s last named street here is Price Street, which corresponds to today’s 8th Street. Eddy’s new map extends the grid southwest until the charter limit at 17th Street. In doing so, Eddy has incorporated — for the first time as far as we are aware — Mission Dolores on a map as an official part of the city of San Francisco. This is a subtle but momentous juncture in the historical mapping of San Francisco because the original impetus and design of Market Street by O’Farrell was most likely a deliberate strategy on the part of the city’s power structure to expand into the flat, open area around Mission Dolores. There was, in effect a slow and obfuscated land grab, which was supported by maps.
Another significant addition that Eddy has made to RED LINE A, is a detailed delineation of Mission Creek. Now almost completely eradicated and covered by the modern city, Mission Creek was for centuries a vital inland artery, first for Native peoples, and later for early residents both before and during the Gold Rush. The overland route from Yerba Buena Cove, despite the straight lines found on official maps, was actually an arduous journey filled with huge sand dunes and marshes. Much easier was travel by boat, leaving the cove and sailing along the shore of the bay, around Rincon and Steamboat points, and up Mission Creek until it was not possible to go further. Boats would then let passengers off a marsh dock, from which Mission Dolores was a short ride up Centre Street (today’s 16th Street).

Mission Creek is the most prominent natural feature on a map largely devoid of them. The context to keep in mind for early San Francisco is that its mapping at this time was ad hoc and more a projection of the city than a reflection of it. As noted collector Warren Heckrotte has pointed out: “A striking feature of this layout of the city is that the grid completely ignores the topography, a pattern which persisted with the growth of the city. Much of the area shown on the map was sparsely populated at this time and some streets were not yet laid out on the ground.” Put another way by McFarland: “As with O’Farrell’s survey, Eddy’s work was a blueprint for development, not a portrait of it.”
The other crucial feature of the RED LINE A map — indeed the very intention of the red line marking itself — was a significant update of the bay’s shoreline. What was really at stake here was money and real estate. San Francisco badly needed funds, and saw a solution in surveying and auctioning off new land. An essential aspect of Eddy’s original survey was thus the creation of new water lots in Yerba Buena Cove; the sale of which provided badly needed revenue to the city. But it wasn’t enough. In the year that passed between the 1850 report map and the 1851 RED LINE A map, Eddy added three new blocks of water lots and streets out into Yerba Buena Cove. Davis and Drumm have been inserted north of Market Street, while Spear, Steuart and East now appear to the south of it. Likewise, along the north edge of the city, three new blocks of streets and water lots have extended the proposed grid. And so, where Eddy’s report map ended at Bay Street, his new RED LINE A maps adds North Point, Beach, and Jefferson Streets.
On the RED LINE A map, the contrast between the natural curves of the original shoreline and the right angles of the proposed shoreline, both of which are highlighted in red, is striking. We see how Eddy — following O’Farrell before him — has, in the words of historian Glenn Robert Lym: “rectified the shoreline into a Cartesian grid by which the city could be systematically extended, and its lands speculated on, subdivided, sold, and bought.” Yet this was not the sole purpose of this map. It was, after all, the “Official Map” — technically speaking, the first official map in which San Francisco had reached the formal status of a city. That speculation in water lots remained an equally crucial factor in creating the map is borne out by the iterations that would follow shortly after, starting with our map.
A second map in 1851: Eddy RED LINE B (our map)
Eddy RED LINE A is quite rare, being known in only five institutional examples: the New York Public Library, Huntington Library, California State Library, Bancroft Library, and the Rumsey Collection. What came next was our map, which we have dubbed Eddy RED LINE B. This chart is even rarer than its predecessor; it is not recorded in the literature nor in any institutional collections, and is perhaps one-of-a-kind, or at least the only surviving copy of a map issued in very few copies.
The most obvious difference between RED LINE A and B is that the word “Official” has been dropped from the title. Other written differences further set this state apart, and also provide clues as to the exact timing of RED LINE B’s publication. At the bottom of the map we find an added imprint line that reads: “Entered according to Act of Congress, in the Year 1851 by Wm. M. Eddy, in the Clerks Office of the District Court of the United States for the Northern District of California.” As mentioned above, it had been necessary for Eddy to file his map in Oregon City one year prior. But the Gold Rush and statehood (September 1850) had since propelled California to importance, and so his new map could be registered within California itself.
Another fascinating clue is found by comparing the publisher information on the two maps. On RED LINE A, lithographer B. F. Butler is listed as located on Clay Street. Indeed, they are known to have worked out of the Post Office Building at Clay Street on Portsmouth Square. On RED LINE B, which is the second map issued in 1851, the publisher is still B. F. Butler, but ‘Clay St.’ has been removed. Why is that? Well, historians of Gold Rush San Francisco point out that the city was ravaged by no less than six destructive conflagrations in under two years during this exact period. The largest of these was the fifth fire, which took place in May of 1851 and raged just up to the Post Office, decimating every building to the east of it. In all likelihood, the fire caused the Butler firm to move: evidence suggests that they decamped three blocks to the north, away from the damage, and we know that by 1852 the firm was operating from Broadway, between Kearney and Dupont. This firmly indicates that our map was printed sometime after May of 1851, yet before the end of the year.

So what was the impetus behind issuing a new map, with an altered title, just months after the first one was formally published? To answer this question we must look to changes within the mapped city itself, which occur at a familiar place: the shoreline. There are two subtle but important differences between Eddy’s two 1851 Red Line maps — both at the shoreline. The street grid has remained the same, but in RED LINE B we see an even newer shoreline projected further out than the RED LINE A projection. In effect, this constitutes a third shoreline, supplementing not only the natural one, but also the end of the street grid in the previous map. The new shoreline stretches around the length of the depicted city, from Larkin and Jefferson Streets in the north, south past Yerba Buena Cove, to about Simmons and South Streets, near the entrance to Mission Creek.
The new projection is interrupted only for important wharves, which leads us to the second important distinction between the two RED LINE maps. In RED LINE B, Eddy has significantly upgraded his depiction of the waterfront by adding the Pacific Street and Market Street wharves. He also shows an updated angle for Long Wharf, as Central Wharf was more commonly called. These wharves were essential infrastructure for the growing city because Yerba Buena Cove was shallow at its shoreline. The wharves reached deeper waters, facilitating the loading and unloading of the massive amounts of cargo needed to sustain a city suddenly awash in people and wealth.
Returning to our question of why two maps were issued in 1851, one in January and the other some time after May, we find a conspicuous event lurking between these two dates. On March 26, 1851, the State of California enacted a new Beach and Water Lot Act, in which the State relinquished title to all lots below high-water mark within San Francisco city limits, essentially granting the lots to either the City of San Francisco or to previous owners (who mostly had received them via former alcalde grants), for a period of ninety-nine years).
Like all land legislation, surveys provided the basis for its implementation, and the March 1851 law brought renewed importance to the defined boundaries of water lots and an increased urgency to exploit their potential as sources of revenue. Newspapers widely advertised the sale of new water lots, and the city of San Francisco paid off debts with promissory notes using water lots as collateral. The speculative real estate rush that had defined the development of San Francisco since the Gold Rush was by the spring and summer of 1851 at fever pitch.
After having studied Eddy’s maps carefully, we believe that RED LINE B should be understood as a transitional work (possibly a proof state), encapsulating a conversion from official map to full-on waterfront real-estate map. The evidence for this is threefold. First, our map is the only known copy. Second, our map has been marked-up along the shoreline in pencil. The markings include a scratching out of places — namely Long and Market Street Wharves, and adjacent projections — that would stay city property and thus never be up for sale, along with modifications and measurements south of Market Street, which seem to suggest that this was a working map rather than any final product. And third and most importantly, Eddy produced a third and final state of this map in 1852, presumably just months after our map had been printed. This 1852 map retains the title without “Official” like RED LINE B, but the date issued has been moved up one year, to January 15, 1852. This map, which we can call RED LINE C, is known in institutional holdings: at Yale, the California Historical Society, and in the Huntington Library, as well as in the San Francisco Department of Public Works.

A third map in the sequence is published in 1852: Eddy RED LINE C
The 1852 Eddy RED LINE C can be understood as the full realization of the city’s water lot policy and the relentless scheming of its officials and residents in the pursuit of speculative profit. It is similar to RED LINE B, except that only the original shoreline is colored red and the waterfront has been updated with extensive new textual information, including: measurements, a label marking the 1851 Water Lot Boundary Line, and — incredibly! — several price figures between the projected waterfronts. The outer line is marked “Peter Smith and Co., Boundary,” which refers to the infamous Dr. Peter Smith, who coerced the city into selling off water lots to pay a debt it owned to him. Two sales took place in summer of 1851, and the largest sale auction was held on January 30, 1852. The third waterfront added to RED LINE B state was thus probably related to these sales (or else coopted for their purpose). Most of the information added to Eddy 1852 would have been available at the time RED LINE B was produced — except perhaps the price figures — which is another argument in favor of our map being a transitional proof state.

Provenance: Samuel Wirth Holladay
In addition to the already touted rarity of this extraordinary map, a note should be made about its important provenance and ownership history. Our map appears to have once belonged to prominent San Franciscan Samuel Wirth Holladay (1823 – 1915), as indicated by Holladay’s signature above the title. Like so many of San Francisco’s earliest residents, Holladay made his way to California from the East Coast (in his case, New York) during the Gold Rush. His first stop was the mining town of Auburn, where he quickly distinguished himself and was elected alcalde by his fellow miners. He transferred to San Francisco in April of 1850, about a year before we believe our map was produced. Holladay established himself in the city as a high-profile land rights lawyer at a time when land was constantly at the center of litigation, whether involving private claimants, old rancho ownership, the federal government, and the city itself. From 1860 to 1863, Holladay served as an attorney for the City and County of San Francisco, and successfully defended the city’s claims to at least seven locations designated for schools, parks, and the county jail.
Holladay certainly seems to have been among the “who’s who” of notable San Francisco figures in the second half of the 19th century, and his autobiography, which is held at the University of California, contains a number of stories that help historians to better understand the time period. Holladay was a member of the Know-Nothings — a nativist political party set on restricting immigration — in the 1856 campaign, and served as a leader of the infamous San Francisco Committee of Vigilance, a vigilante group formed in response to crime and corruption. Holladay grew to become a wealthy landholder himself, and constructed an Italianate mansion known as Holladay Heights, which became a hub for social and political gatherings, with visits by notable figures such as Bret Harte, Mark Twain, Leland Stanford, and William Crocker. The real backstory behind the construction of Holladay Heights, however, is that it was on a parcel of land claimed by both Holladay and the city of San Francisco as part of Lafayette Park. Holladay eventually won the legal case and it is for this reason that today the St. Regis Apartment Building cuts into the park from Gough Street.
Despite being a prominent property lawyer in a time beset with competitive suits and cases over land, Holladay is perhaps most renowned as a jurist for taking on the case of run-away slave Frank. Remarkably, he did so at the behest of the African-American community of San Francisco. Essentially, Frank had run away from his Missouri-based owner while in California, and hence no property rights could be exerted over him. The active engagement of the Black community may be one of the first examples of active civil organization among the African-American populace in California. As their lawyer, Holladay came to be considered a champion of their cause and a pioneer in civil-rights litigation.
Cartographer(s):
William Eddy was born in New York and worked as an engineer on the state’s canals. He arrived in San Francisco in 1849 amidst the excitement of the Gold Rush and was appointed as a land surveyor.
Condition Description
Folding map with hand-drawn red line. Backed with thin tissue paper. A few losses at fold intersections and some minor soiling at the right side of the map.
References

